Sensor List
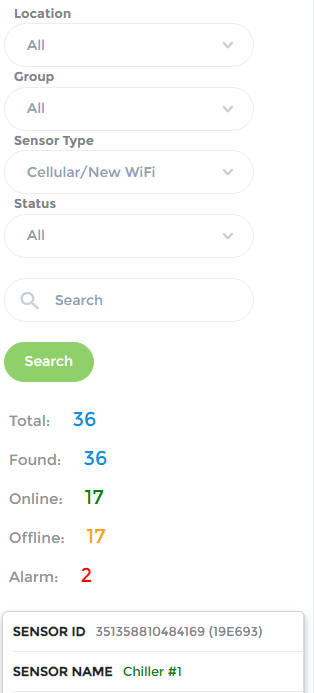
Click the device_thermostat icon on the naviagation menu. The sensor list will display different columns depending on the sensor type. The image below shows the sensor list for cellular sensors.
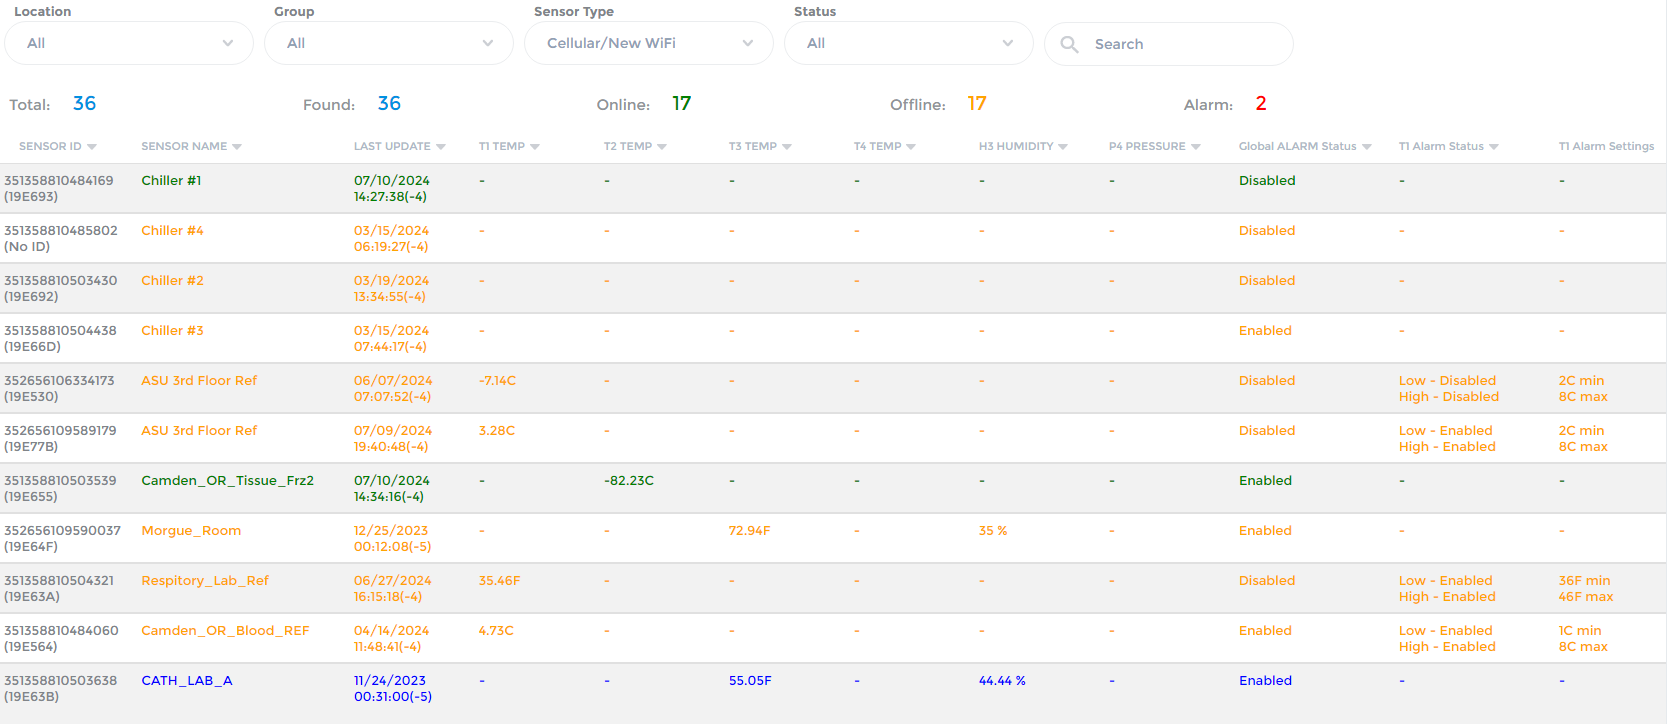
| Color | Status |
|---|---|
| Green | The sensor is online and all probes are within the alarm range. |
| Red | At least one (1) sensor probe is above the high alarm range. |
| Blue | At least one (1) sensor probe is below the low alarm range. |
| Orange | The sensor has not communicated with the host during its Publish interval and is offline. |
| Filter | Description |
|---|---|
| Location | Use the Location dropdown to filter the list based on location. |
| Group | Use the Group dropdown to filter the list based on group. |
| Sensor Type | Use the Sensor Type dropdown to filter the list based on sensor type. The current sensor types are Cellular/New WiFi (the default) and Legacy (WiFi/Lora). |
| Status | Use the Status dropdown to filter the list based on whether the sensor is Online, Offline, or in Alarm status. |
| Search | Enter text to filter the list based on the text. When viewing in mobile mode, click the Search button to execute the search. |
| Total | Total number of sensors for the selected Status. |
| Found | Total number of sensors (filtered). |
| Online | Total number of online sensors (filtered). |
| Offline | Total number of offline sensors (filtered). |
| Alarm | Total number of active alarms (filtered). |
| Field | Description |
|---|---|
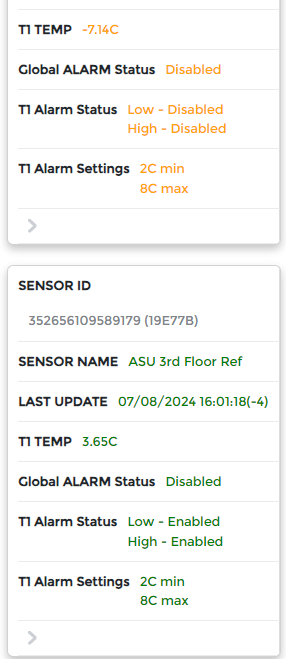
| Sensor ID | The unique ID of the sensor. Click the Sensor ID to view the sensor Charts page. |
| Name | The name you have defined for the sensor. |
| Last Update | The timezone adjusted date and time the sensor last communicated with the Spider Thermo host. |
| Temp, Humidity, Pressure | The last recorded temperature, humidity, and pressure values. The values displayed are dependent on the sensor type and number of probes. |
| Global Alarm Status | Indicates whether alarms are enabled at the sensor level. |
| Probe Alarm Status | Indicates whether alarms are enabled at the probe level. |
| Alarm Settings | The high and low ranges set for a probe. |
| Last Alarm | The date and time the last alarm was triggered for the probe. |
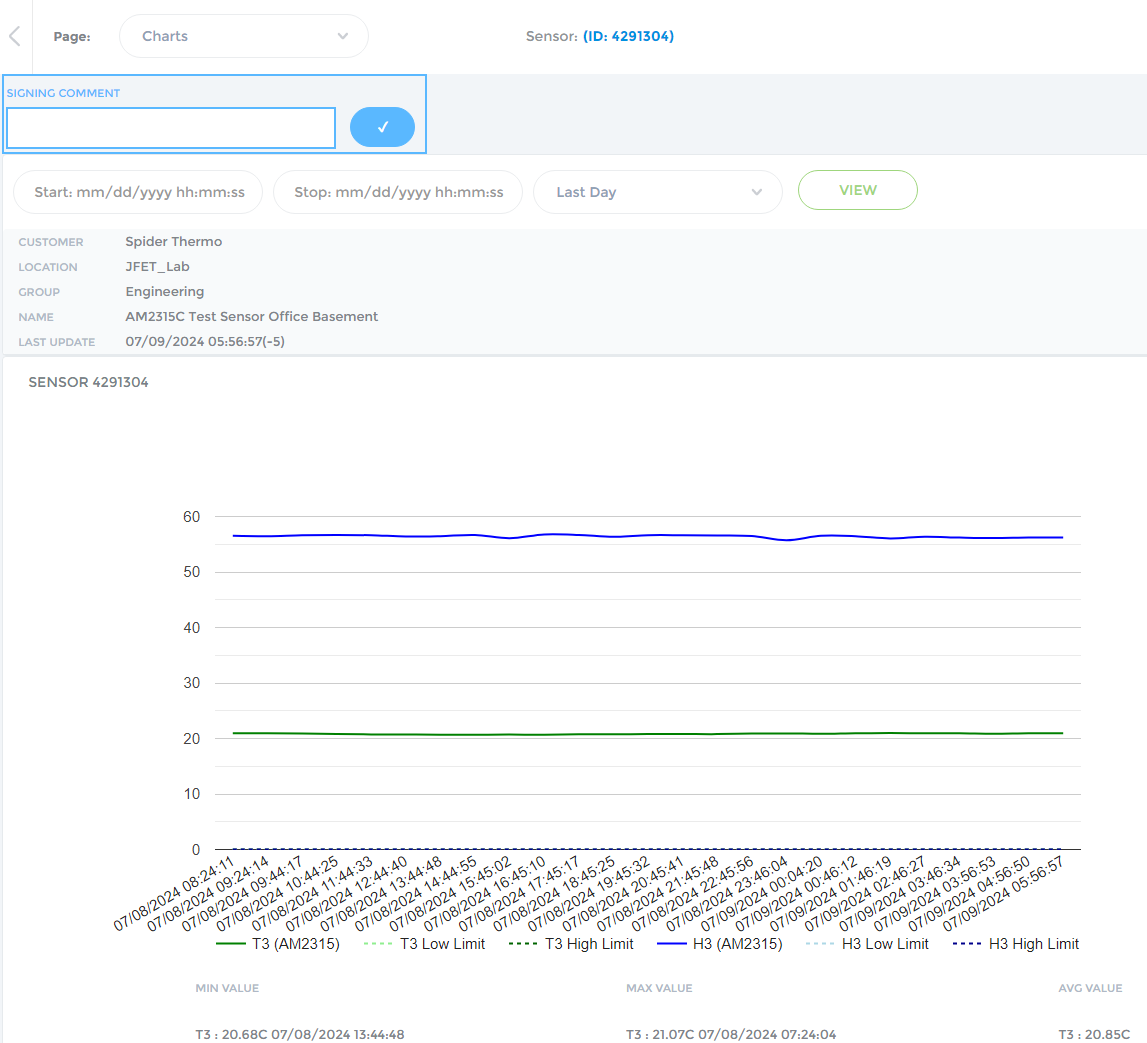
Sensor Charts
Click the Sensor ID value on the sensor list to view the sensor Charts page. Use the Charts page to view the sensor data in graphical format.
| Field | Description |
|---|---|
| Page | Use the Page dropdown to navigate to the Charts, Overview, Individual Reports, and Summary Reports pages. |
| Sensor Id | The unique ID for the sensor. Click on the link to access the Sensor Details page. |
| Signing Comment | You can record a short comment to a particular time interval for a sensor. For instance, you may want to acknowledge a sensor alarm or a sensor status change. The comments will appear on the Summary Report. Enter your comment in the text box and click the ✔ button to save the comment. |
| Chart Options | The sensor chart shows sensor data in graphical format. You can change the time range for the chart by selecting the time ranges from the dropdown. By default, the chart will display the Last Day of data. You can select predefined intervals of Last 15 Minutes, Last Hour, Last Week, Last Month, or Last Year. You can also select a custom range by selecting calendar values into the Start and Stop fields. Click the View button to refresh the chart. |
| Customer | Your customer name. |
| Location | Location assigned to the sensor. |
| Group | Group assigned to the sensor. |
| Name | Name of the sensor. |
| Last Update | The date and time of the last data packet received from the sensor. |
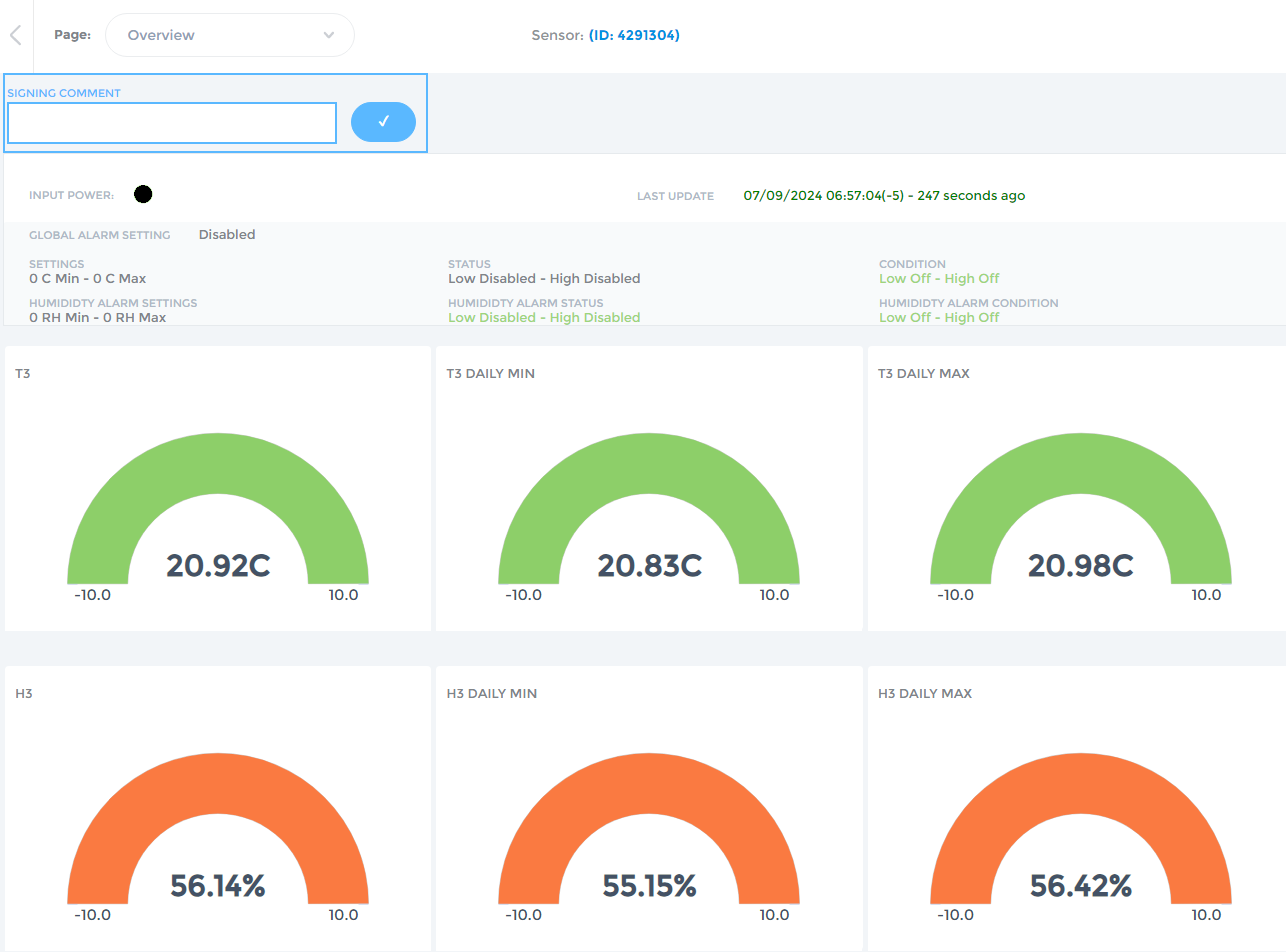
Sensor Overview
Select the Overview value from the Page dropdown. Use the Overview page to view the sensor probe data in graphical format.
| Field | Description |
|---|---|
| Page | Use the Page dropdown to navigate to the Charts, Overview, Individual Reports, and Summary Reports pages. |
| Sensor Id | The unique ID for the sensor. Click on the link to access the Sensor Details page. |
| Signing Comment | You can record a short comment to a particular time interval for a sensor. For instance, you may want to acknowledge a sensor alarm or a sensor status change. The comments will appear on the Summary Report. Enter your comment in the text box and click the ✔ button to save the comment. |
| Input Power | If enabled, the Input Power icon will show green or red. If disabled, it will show black. |
| Last Update | The date and time of the last data packet received from the sensor. |
| Global Alarm Setting | Indicates if alarms are enabled for the sensor. |
| Settings | The low and high range settings for the probe. |
| Status | Indicates whether alarms are enabled for the probe. |
| Condition | Indicates if the proble is in alarm status. |
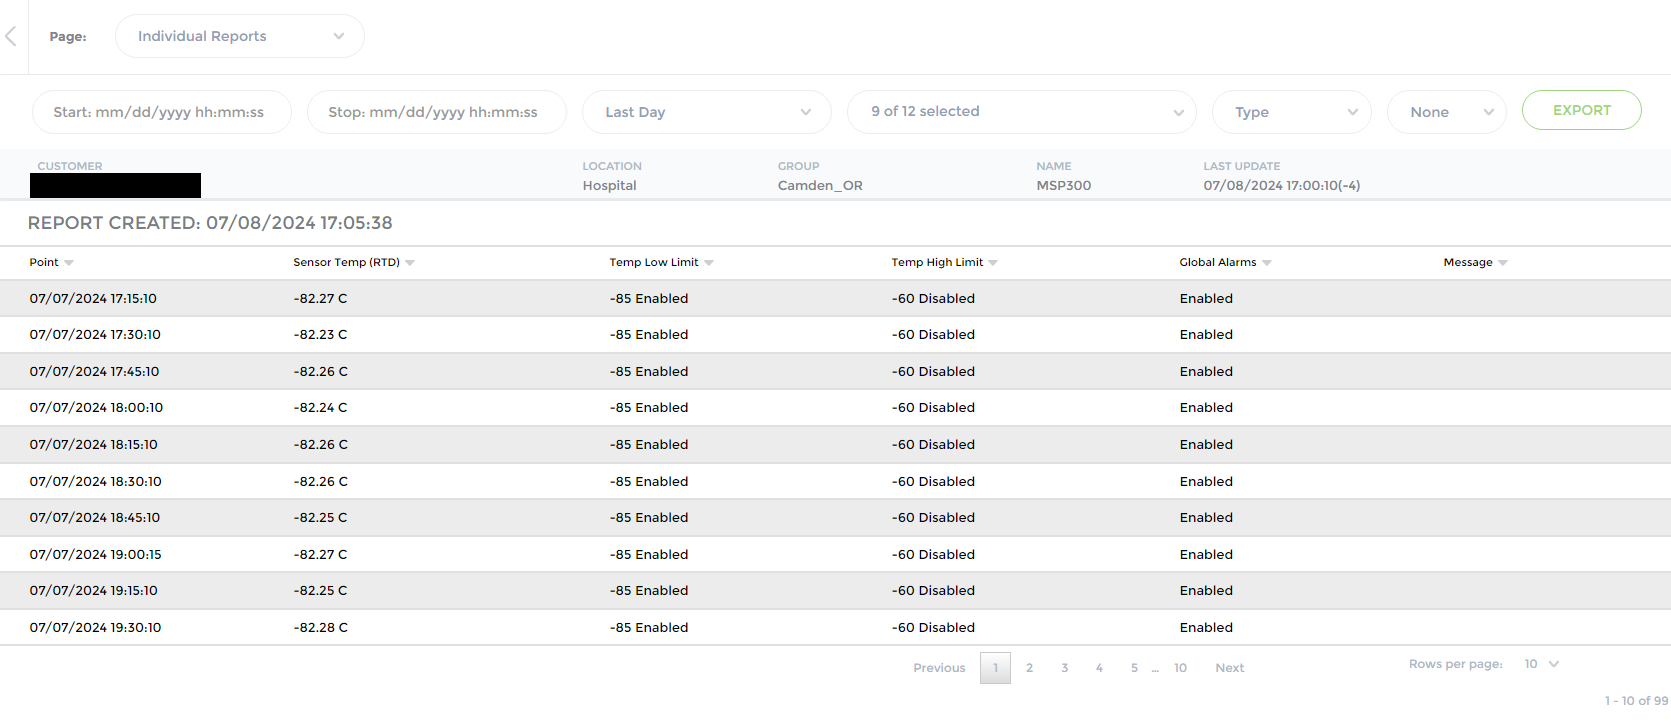
Individual Reports
Select the Individual Reports value from the Page dropdown. This page provides the ability to create a detailed report of the sensor readings for a specific date/time range.
| Field | Description |
|---|---|
| Page | Use the Page dropdown to navigate to the Charts, Overview, Individual Reports, and Summary Reports pages. |
| Range Options | You can change the time range for the chart by selecting the time ranges from the dropdowns. You can select predefined intervals of Last 15 Minutes, Last Hour, Last Week, Last Month, or Last Year. You can also select a custom range by selecting calendar values into the Start and Stop fields. Click the View button to refresh the chart. |
| Probe | For non-legacy sensors, use the Probe dropdown to select the types of probes to include in the report. |
| Type | For legacy sensors, use the Type dropdown to select the type of report. |
| Output | Use the Output dropdown to select the format of the report. The default value of None will display the report on the screen. You can also select PDF or CSV to download the report in that format. |
| Customer | Your customer name. |
| Location | Location assigned to the sensor. |
| Group | Group assigned to the sensor. |
| Name | Name of the sensor. |
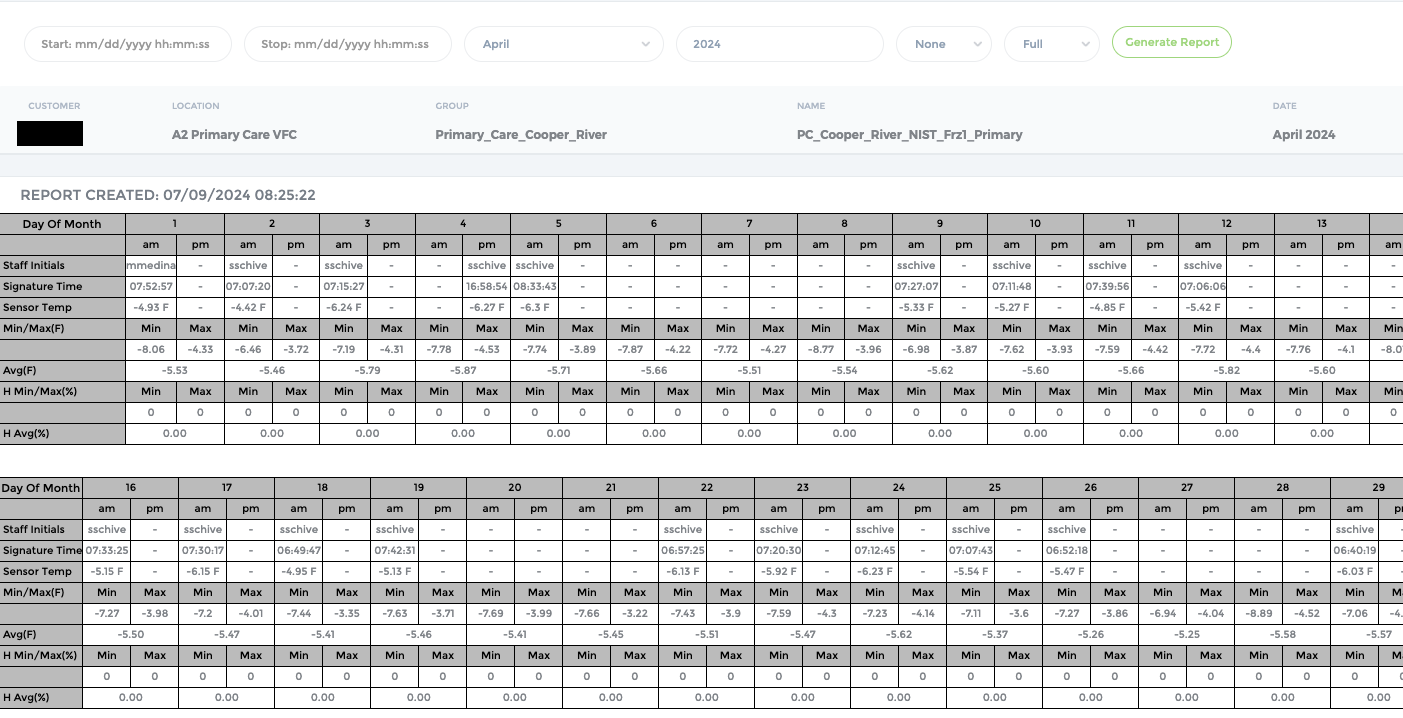
Summary Reports
Select the Summary Reports value from the Page dropdown. The Summary Report page provides the capability of creating a summary report of the sensor readings for a specific date/time range
| Field | Description |
|---|---|
| Page | Use the Page dropdown to navigate to the Charts, Overview, Individual Reports, and Summary Reports pages. |
| Range Options | You can change the time range for the chart by selecting the time ranges from the dropdowns. You can select predefined intervals by selecting a month and year from their dropdowns. You can also select a custom range by selecting calendar values into the Start and Stop fields. Click the Generate Report button to refresh the chart. |
| Output | Use the Output dropdown to select the format of the report. The default value of None will display the report on the screen. You can also select PDF or CSV to download the report in that format. |
| Type | The Full version lists the summary report for the sensor, all the Sign-In Data, and comments for the Sensor. The Minimal version will only include the summary report for the Sensor Readings. |
| Customer | Your customer name. |
| Location | Location assigned to the sensor. |
| Group | Group assigned to the sensor. |
| Name | Name of the sensor. |
| Date | Date raange of the report. |
| Samples | Number of data packets used in the report. |